Editor: Interface Overview
Editor: Interface Overview
Alyvix Editor lets you visually create, edit and run complex scripts allowing Alyvix to interact with your applications just like a human user would. Each script consists of multiple test case objects, organized as sequential, conditional and loop commands, along with Sections and Maps.
The Editor interface includes the Alyvix Selector and Designer modules as collapsible panels, which lets you easily inspect and choose test case objects to include when building your scripts.
To run Alyvix Editor from the command prompt, use the following command:
C:\Alyvix\testcases> alyvix_editor -f <alyvix-file-name>
This loads the Editor interface, whose layout has the following elements:
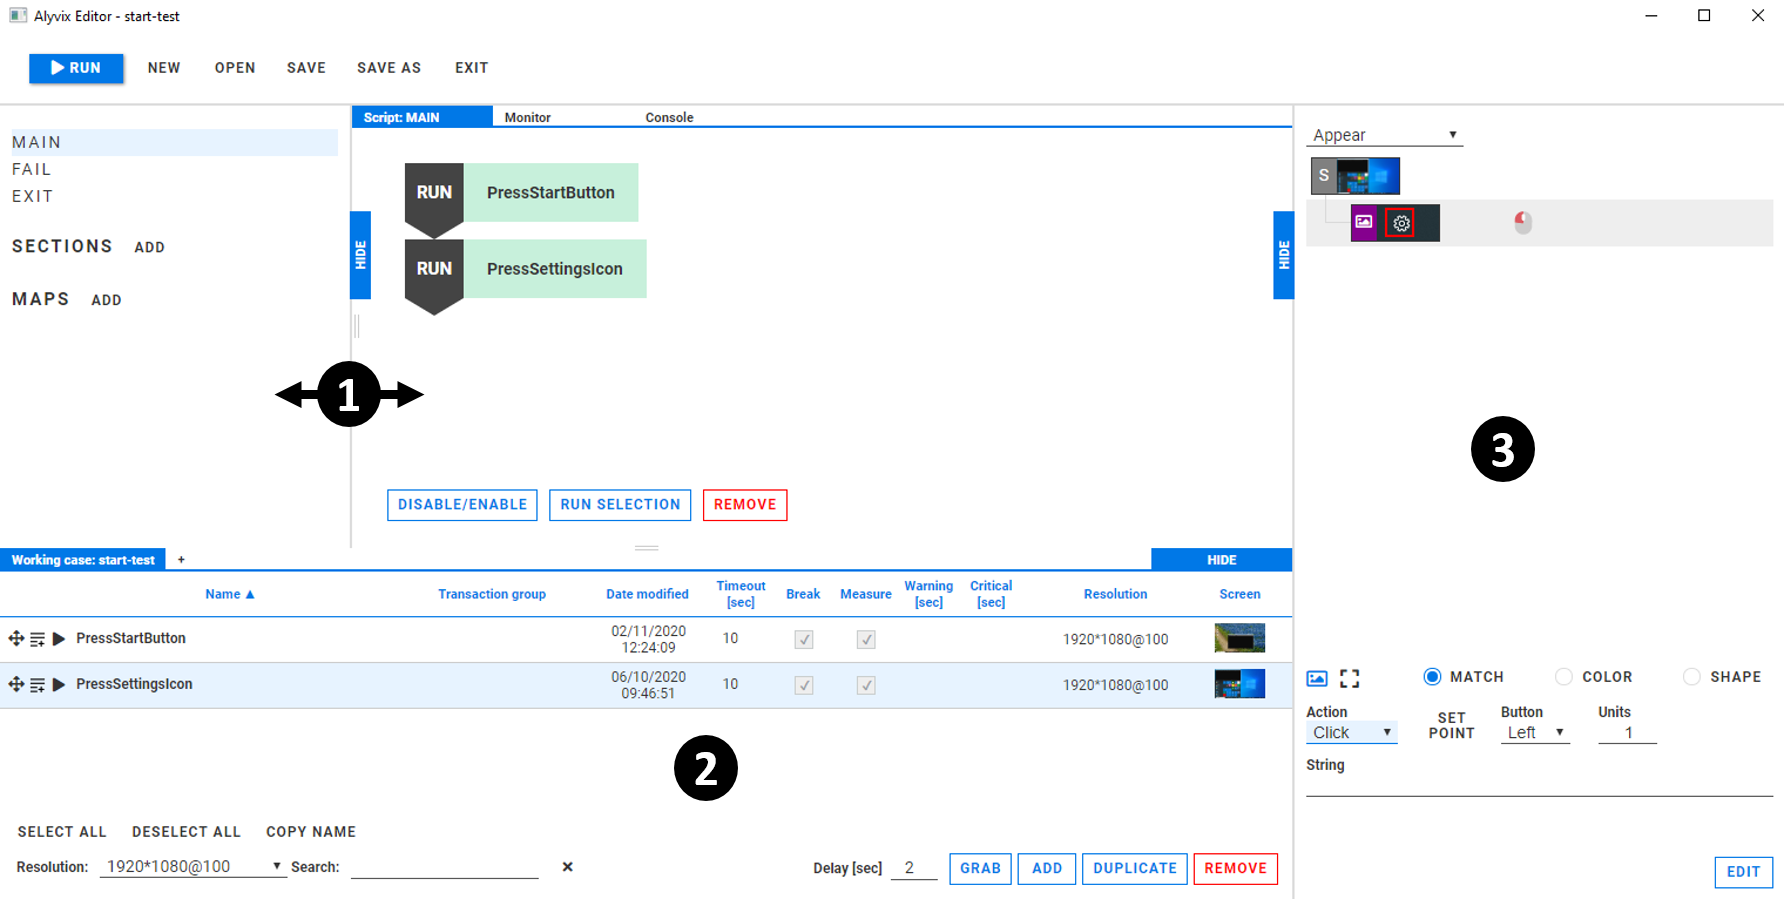
The Editor panel, consisting of the Script Management panel (left) and the Scripting panel (right)
The Selector pane, containing test case objects that can be added to the Scripting panel
The Designer pane, which shows the details of the currently selected test case object
Editor-Specific Features
The principle interface elements specific to Alyvix Editor are:
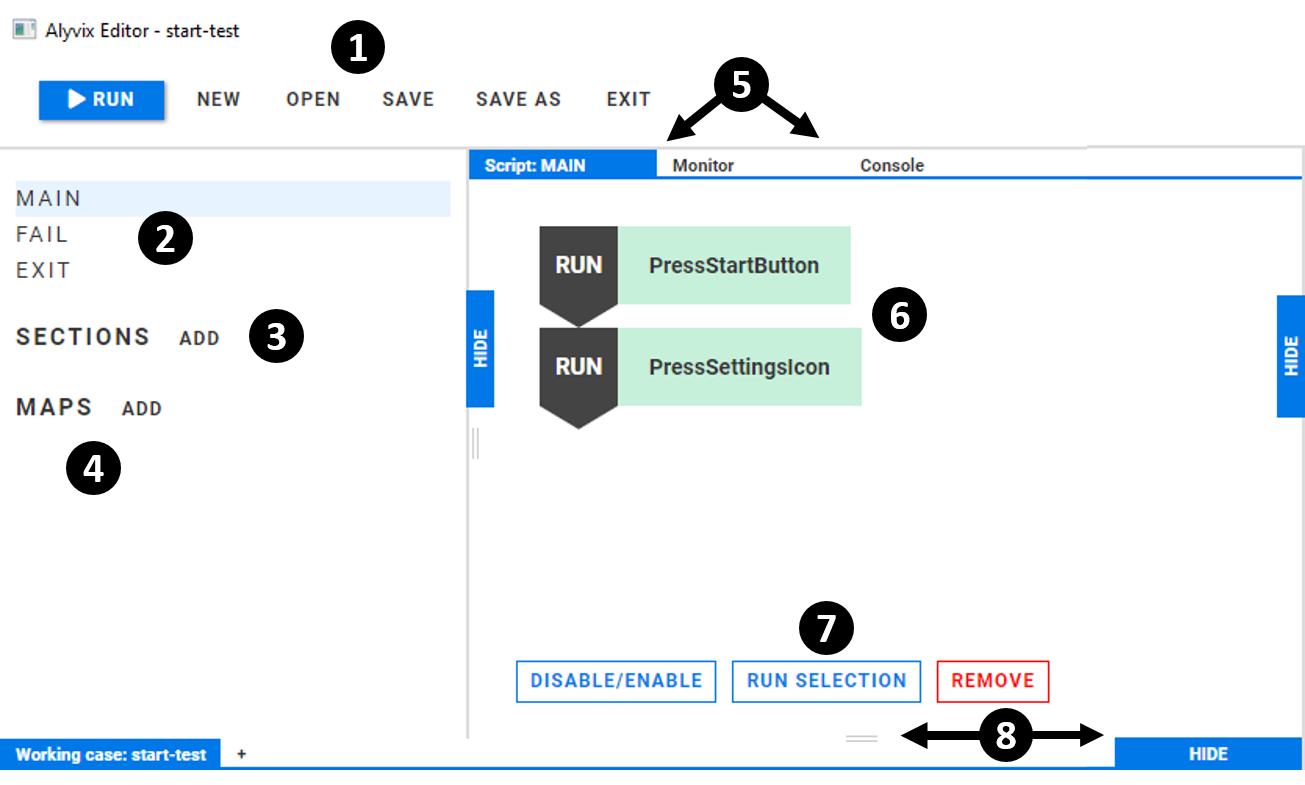
The test case menu (described below), containing actions for Alyvix Editor and the current test case
The main Script Management panel, used to select the principal scripts to be edited
The Sections list, containing user-defined scripts (sections ) that can be used as subroutines within any of the principal scripts
The Maps list, containing user-defined maps (consisting of keys and one or more values for each key) that can be used either by a script via looping, or to insert values in a String field.
The scripting mode selector, containing the Script tab to display the currently selected script or map, the Monitor tab to show the screen capture of Selector’s current test case object, and the Console tab to show the output along with any potential failure causes after running the test case script from within Alyvix Editor
The scripting panel, containing individual scripting nodes and the logic connecting them
The script properties and actions that work both for single nodes and subsets of nodes, where you can enable, disable, run, or remove the scripted elements that have been placed in the scripting panel
Panel resizing controls, allowing you to resize, minimize, or restore the three peripheral panels
The Monitor Tab
When you just need to quickly look at the positions of components in a test case object without making any changes, the fastest way isn’t to return to editing the test case object in Designer. Instead you can use the monitor tab to see the screen capture for the currently selected test case object.
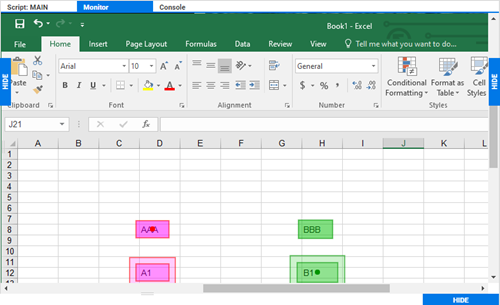
The monitor tab displays a read-only, full-size, instantly available copy of the screen grab for the test case object currently opened in the Designer panel.
Launching Alyvix Robot from Alyvix Editor
The script of the currently loaded test case can be run directly in Editor by pressing
the  button at the top left. The default starting point is the script
in the script management panel (you can
use the debugging methods available in Alyvix Editor to
change this starting point).
When run, Editor will be minimized until the scripted interaction has completed, after which the Editor window will return, and the output will appear in the Console tab at the top of the scripting panel:
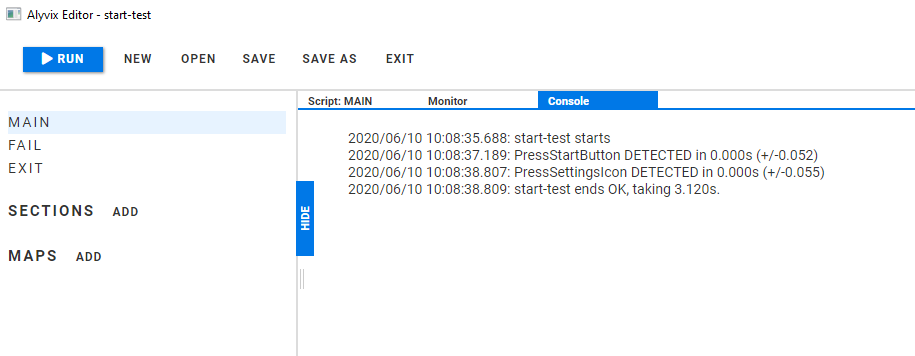
The structure of the output is the same regardless of whether the test case is started in Editor or run in the command prompt. The effect of the Break and Measure flags are described in detail in the Test Execution section.
In addition, if a failure was caused by a simple sequential scripting node, then the annotated screenshot describing the failure will be displayed below the output in the Console tab:
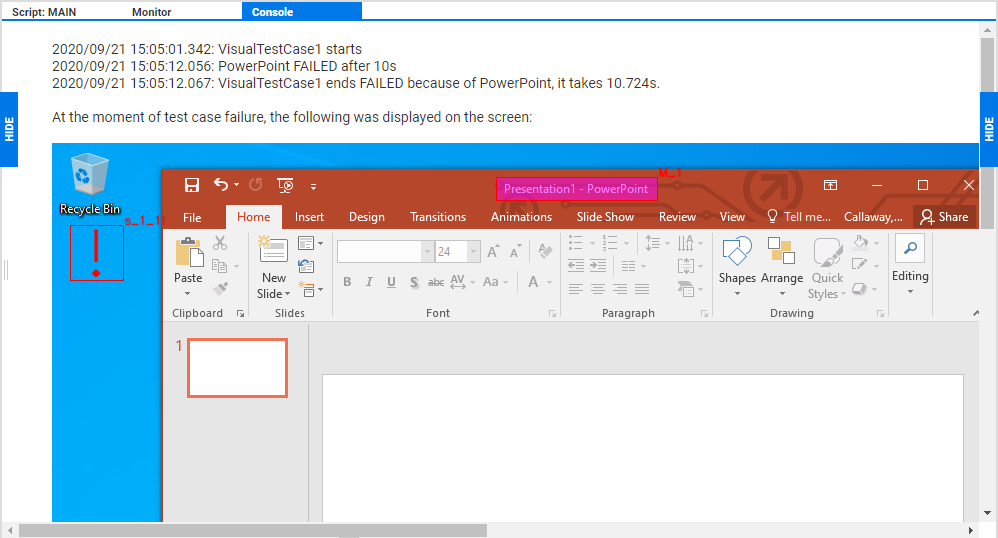
The annotation indicates the position, size and group of the first component that could not be matched during execution. In the PowerPoint example shown above, the Paste icon was marked as a subselection in the first group without an enlarged region of interest, so reducing the window horizontally means the Paste icon no longer fell within that region. The exclamation mark inside the red square representing the color of the first group indicates where Alyvix expected to find the Paste icon.
Note
Note that currently arguments such as a private key and the verbosity level for Alyvix Robot cannot be set within Editor.